 |
 |
 |
 |
 |
 |
 |
 |

Skills
Read the complementary text to understand what language to use to describe trends presented in graphs and complete the two tasks given below.
Task 1. Take whatever issue of the Wall Street Journal, go to the Money and Markets section and pick words used to describe different trends. Make your own list, give explanations in English and indicate which of the verbs can be used as nouns with the same meaning. Support the words with sentences from the text
Mail your answers to the instructor.
Task 2. Describe the following graph and bar charts using some of the language you have learned so far. The Wall Street Journal Europe can be very helpful.
The following graph is taken from the April 2
edition of the Wall Street Journal Europe. It describes the trends in European
equity markets .

Daily closing level FTSE 100 share price index
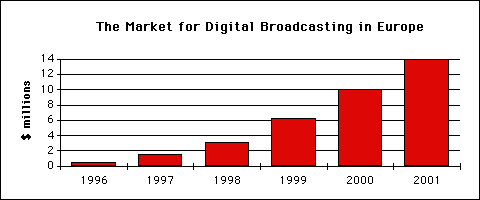
The next bar chart is taken from the same edition of the WSJ. It represents the trends in the market for digital broadcasting in Europe.

Projected number of households in Europe receiving digital broadcasting.
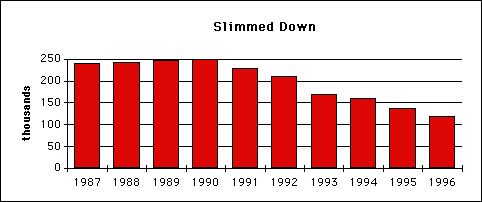
The last bar chart taken from April 8 edition of the WSJ represents how the number of BT workers changes during the years. Do not forget to use some of the adjectives for indicating size of change, mentioned earlier.

Number of BT employees.
Describe the graphs and mail your descriptions to the instructor.
